Access the latest results, presentations, key indicators and important investor updates.
Access the latest results, presentations, key indicators and important investor updates.


| Consolidated (in millions of EUR) | 2020 | 2021 | 20221) | 2023 | 2024 |
| Development of sales | |||||
| Sales | 2,528.4 | 3,069.7 | 4,682.1 | 4,164.4 | 4,079.6 |
| Earnings data | |||||
| Adjusted EBITDA | 398.9 | 421.0 | 729.9 | 419.0 | 418.5 |
| Adjusted operating profit | 268.0 | 269.6 | 562.4 | 229.2 | 190.0 |
| Operating profit | 231.4 | 269.6 | 510.4 | 197.6 | 190.0 |
| Profit for the year | 162.2 | 190.7 | 345.3 | 89.1 | 110.5 |
| Cash flow from operating activities | 318.2 | 269.8 | 299.7 | 786.2 | 516.3 |
| Free cash flow | 173.8 | 37.9 | (19.7) | 369.8 | 302.2 |
| Capital expenditures/depreciation | |||||
| Capital expenditures | 152.8 | 248.4 | 329.4 | 425.3 | 220.9 |
| Depreciation and amortisation2) | 167.5 | 151.4 | 219.5 | 221.4 | 228.5 |
| Employees | 9,938 | 12,492 | 15,640 | 15,087 | 14,710 |
| Profitability indicators | |||||
| Return on equity | 10.6 % | 11.9 % | 19.1 % | 4.5 % | 5.3 % |
| Return on assets | 7.1 % | 6.7 % | 8.6 % | 3.1 % | 4.0 % |
| Net profit margin | 6.4 % | 6.2 % | 7.4 % | 2.1 % | 2.7 % |
| Adjusted EBITDA margin | 16.3 % | 13.7 % | 16.4 % | 10.8 % | 10.3 % |
| Adjusted Operating margin | 10.6 % | 8.8 % | 12.0 % | 5.5 % | 4.7 % |
| Return on capital employed3) | 15.8 % | 12.8 % | 17.9 % | 6.5 % | 5.6 % |
| Return on investment3) | 9.4 % | 8.8 % | 11.1 % | 3.9 % | 5.1 % |
| Balance Sheet Indicators | |||||
| Equity ratio | 64.5 % | 41.4 % | 40.7 % | 39.6 % | 43.8 % |
| Property, plant and equipment to total assets | 41.5 % | 37.1 % | 37.3 % | 40.5 % | 41.6 % |
| Total equity and non-current liabilities to property, plant and equipment | 2.0 | 2.2 | 2.1 | 1.9 | 1.9 |
| Working capital | 584.4 | 809.3 | 1,028.3 | 842.3 | 776.3 |
| Financial indicators | |||||
| Net debt3) | 122.2 | 1,063.5 | 1,481.5 | 1,261.9 | 1,078.7 |
| Net debt/Adjusted EBITDA3) | 0.3 | 2.1 | 1.9 | 2.8 | 2.6 |
| Net debt/equity3) | 7.9 % | 64.0 % | 75.6 % | 62.7 % | 50.7 % |
| Share performance indicators | |||||
| Market capitalisation4) | 3,300 | 3,532 | 3,024 | 2,532 | 1,592 |
| Earnings per share (in EUR) | 8.06 | 9.46 | 17.19 | 4.36 | 5.41 |
| Dividend per share (in EUR) | 3.20 | 3.50 | 4.20 | 1.50 | 1.805) |
1) adjusted due to the adjustment of the acquisition of Essentra Packaging
2) incl. impairments and write-ups on property, plant and equipment and intangible assets as well as non-current assets held for sale
3) incl. cash and cash equivalents and financial liabilities of the TANN Group
4) per ultimo
5) proposed for 2024
| (consolidated, in millions of EUR) | Q1/2024 | Q2/2024 | Q3/2024 | Q4/2024 | Q1/2025 | Q2/2025 |
| Sales | 1,025.0 | 1,018.9 | 1,024.9 | 1,010.8 | 1,042.6 | 987.4 |
| Adjusted EBITDA1) | 94.5 | 107.2 | 94.0 | 122.8 | 119.3 | 111.2 |
| Adjusted EBITDA margin (%) | 9.2 % | 10.5 % | 9.2 % | 12.2 % | 11.4 % | 11.3 % |
| Adjusted operating profit1) | 39.6 | 51.0 | 35.7 | 63.7 | 61.0 | 55.7 |
| Adjusted operating margin (%) | 3.9 % | 5.0 % | 3.5 % | 6.3 % | 5.8 % | 5.6 % |
| Operating profit | 39.6 | 51.0 | 35.7 | 63.7 | 55.5 | 178.5 |
| Capital employed2) (LTM) | 3,515.0 | 3,455.2 | 3,410.6 | 3,376.9 | 3,407.8 | 3,429.3 |
| Return on capital employed2) (LTM) (%) | 5.4 % | 5.6 % | 4.8 % | 5.6 % | 6.2 % | 6.3 % |
| Profit before tax | 18.0 | 33.2 | 19.7 | 43.4 | 31.8 | 163.0 |
| Income tax expense | (7.1) | (6.7) | (4.8) | 14.8 | (10.7) | (19.8) |
| Profit for the period | 10.9 | 26.5 | 14.9 | 58.2 | 21.1 | 143.2 |
| Net profit margin (%) | 1.1 % | 2.6 % | 1.5 % | 5.8 % | 2.0 % | 14.5 % |
| Earnings per share (in EUR) | 0.52 | 1.30 | 0.72 | 2.87 | 1.04 | 7.25 |
| Cash flow from operating activities | 52.5 | 148.1 | (33.0) | 348.7 | (128.2) | 24.9 |
| Free cash flow3) | (38.5) | 97.9 | (78.2) | 321.0 | (183.5) | (21.9) |
| Capital expenditures | 92.8 | 52.7 | 45.8 | 29.6 | 55.7 | 49.6 |
1) adjusted for material one-off effects. To enhance significance of the earnings figures in the divisions, management now defines “material” as impact of more than EUR 5 million on operating profit (previously more than EUR 10 million).
2) The calculation is based on the last twelve months.
3) Cash flow from operating activities plus proceeds from disposals of property, plant and equipment and intangible assets as well as government grants less payments for acquisition of property, plant and equipment and intangible assets (incl. payments on account).
1) including interdivisional sales
2) adjusted for material one-off effects. To enhance significance of the earnings figures in the divisions, management now defines “material” as impact of more than EUR 5 million on operating profit (previously more than EUR 10 million).
3) The calculation is based on the last twelve months.
4) Cash flow from operating activities plus proceeds from disposals of property, plant and equipment and intangible assets as well as government grants less payments for acquisition of property, plant and equipment and intangible assets (incl. payments on account).
1) including interdivisional sales
2) The calculation is based on the last twelve months.
3) Cash flow from operating activities plus proceeds from disposals of property, plant and equipment and intangible assets as well as government grants less payments for acquisition of property, plant and equipment and intangible assets (incl. payments on account).
4) including coated liner
5) Chemical pulp and CTMP

Results for the 1st Half-Year 2025
MM Group awarded place on CDP “A List” for Climate and Supplier Engagement
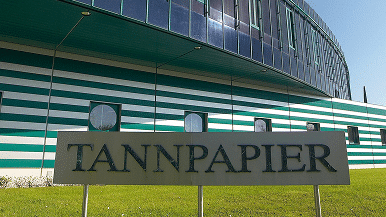
MM closes sale of TANN Group
Results for the first quarter of 2025
Franz Hiesinger reappointed CFO
Annual Results 2024
Ad-hoc: Mayr-Melnhof Karton Aktiengesellschaft decides on share repurchase programme
INVESTORS
We look forward to your message and always seek a prompt answer.
INVESTORS
To keep you regularly updated about company reports and press releases, we offer subscription to our publication mailing for shareholders and stakeholders.